


One of the most requested skills new/developing traders want to learn is about finding ‘tops and bottoms’. While certain parabolic tops can be seen days or weeks in advance, the market doesn’t always announce the top. It can (and often does) hesitate at said tops. Prior examples would be:
-2000 dot com bubble
-2007/08 GFC
-2022 Russian war against Ukraine
When looking at the price action over the last four weeks in SPY, the bulls feel a bit ‘nervous’ or ‘uncertain’. We’re not really seeing a breakdown, nor a resumption, but a market that ran hard off the April lows and has since gone quiet at the highs. Quiet in a way that deserves attention.
What the Weekly Chart Is Telling You
The SPY weekly chart tells a clean story in two acts. Here’s what I’m seeing.
Act one: a near-vertical impulse off the April lows, one of the sharpest recovery moves of the year, carrying price from the $640’s all the way to the $755 highs by late May. You should see strong momentum, expanding candles, and clear directional conviction.
Act two: which is the last four weeks. You should notice price has stalled in a tight corrective structure roughly between $732 and $755. The candles are mixed in size but unified in one respect…they’re going nowhere. Monthly VWAP sits at $739.95, right in the middle of the congestion. The market isn’t collapsing. But it does seem like its deliberating.
SPY Weekly Chart
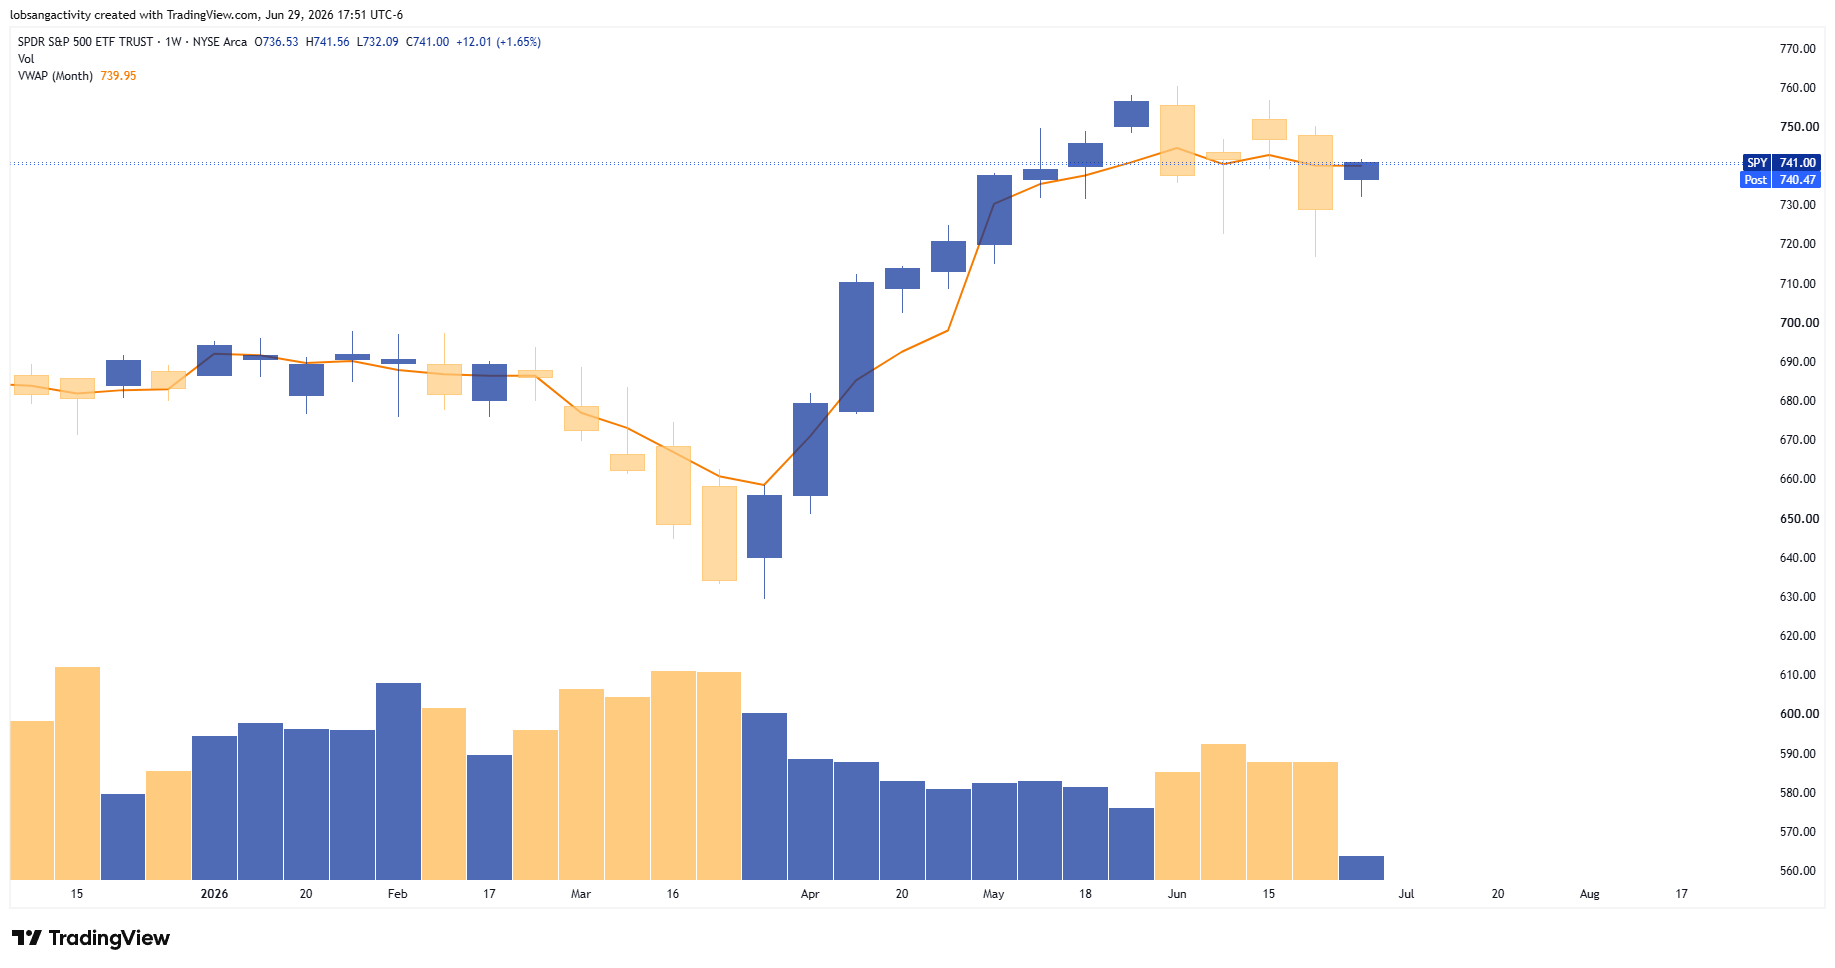
That deliberation near the top of a big move, after a period of euphoric recovery, is what traders mean when they say “nervous top.” It doesn’t mean the market is about to crash. It means the easy money from the April lows has been made, and what comes next requires a harder read.
Where the Read Gets More Interesting: AI Leadership
If you want to know what the broad market is likely to do, watch what its leadership is doing first. Right now, the AI semiconductor names, which are the stocks that led the recovery — are telling a differentiated story. Not uniform strength. Not uniform weakness. Something more interesting: a fractured structure from the outside in. Let’s look at several tickers/charts below to demonstrate what I mean.
ARM
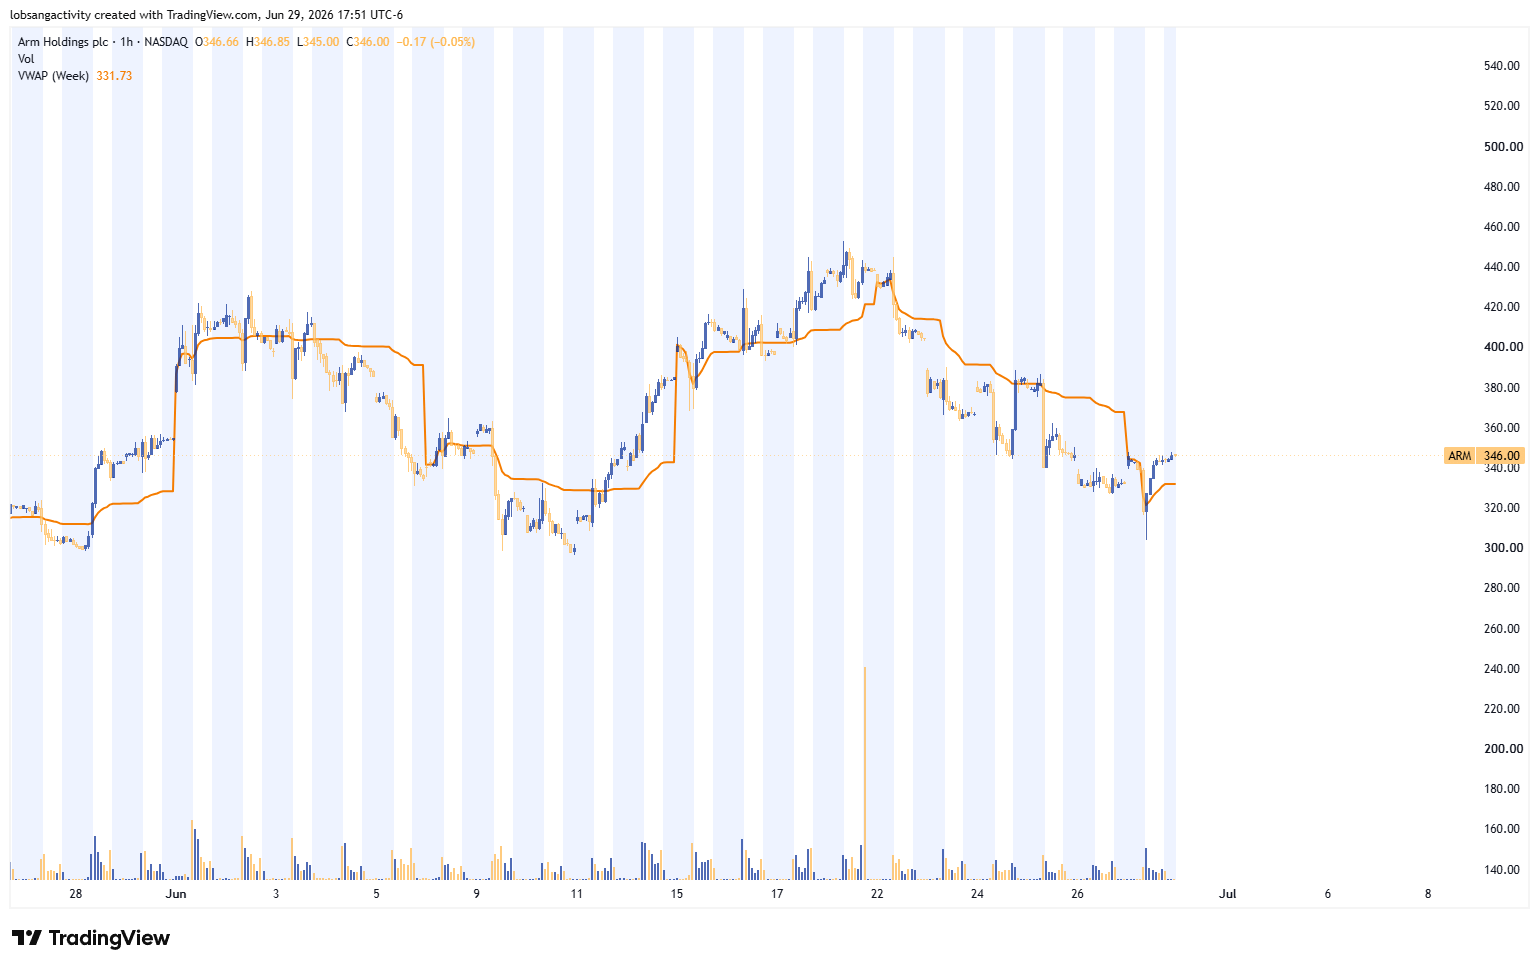
You can see that ARM peaked around $452 on June 18th after a strong recovery from the early June lows. The bounce off the bottom was impulsive and real. But on June 18th and 19th, that momentum stalled. Price is now at $346, struggling to reclaim prior structure. The highest-multiple names roll first at tops, which IMO is not a coincidence, it’s how distribution works. The most speculative positioning usually unwind before the institutional core.
ARM Weekly Chart
SNDK
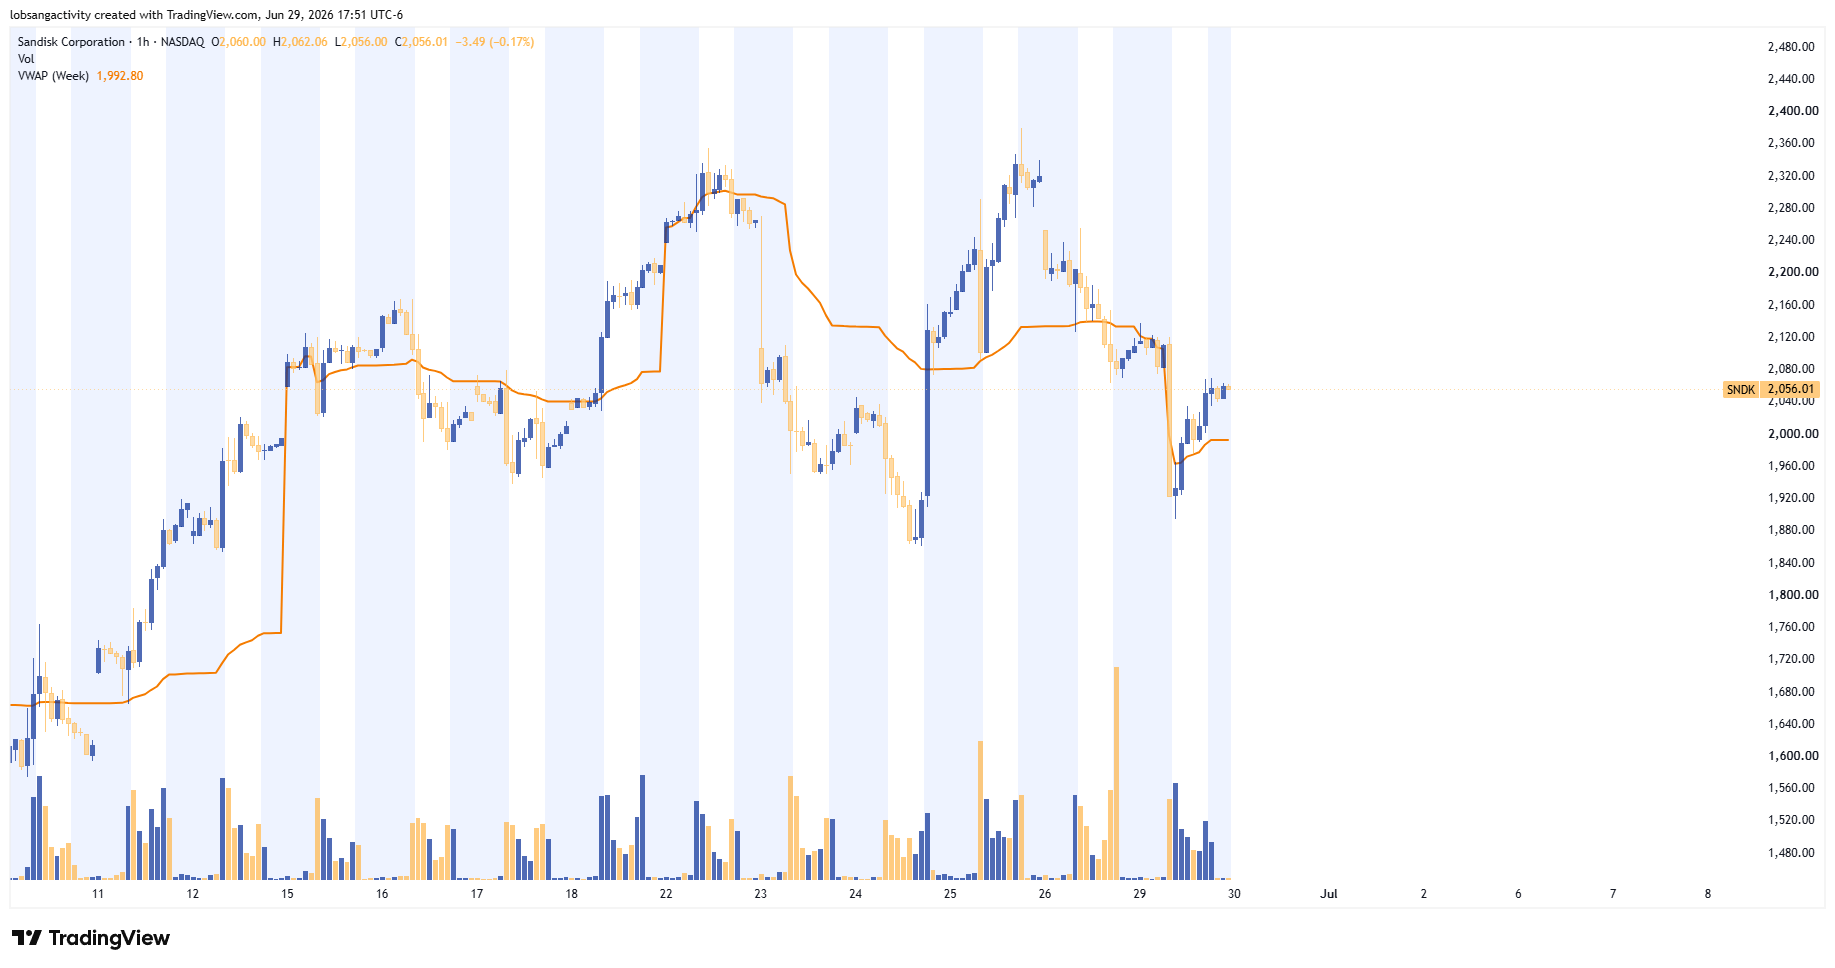
This stock shows a cleaner topping structure. Two peaks at nearly the same level, right around $2,350 on June 22nd and again on June 25th, with the second slightly exceeding the first. Price has since flushed hard and is now attempting to recover, but the same double top has already printed. Counter-trend sellers are organized there.
SNDK Weekly Chart
MU
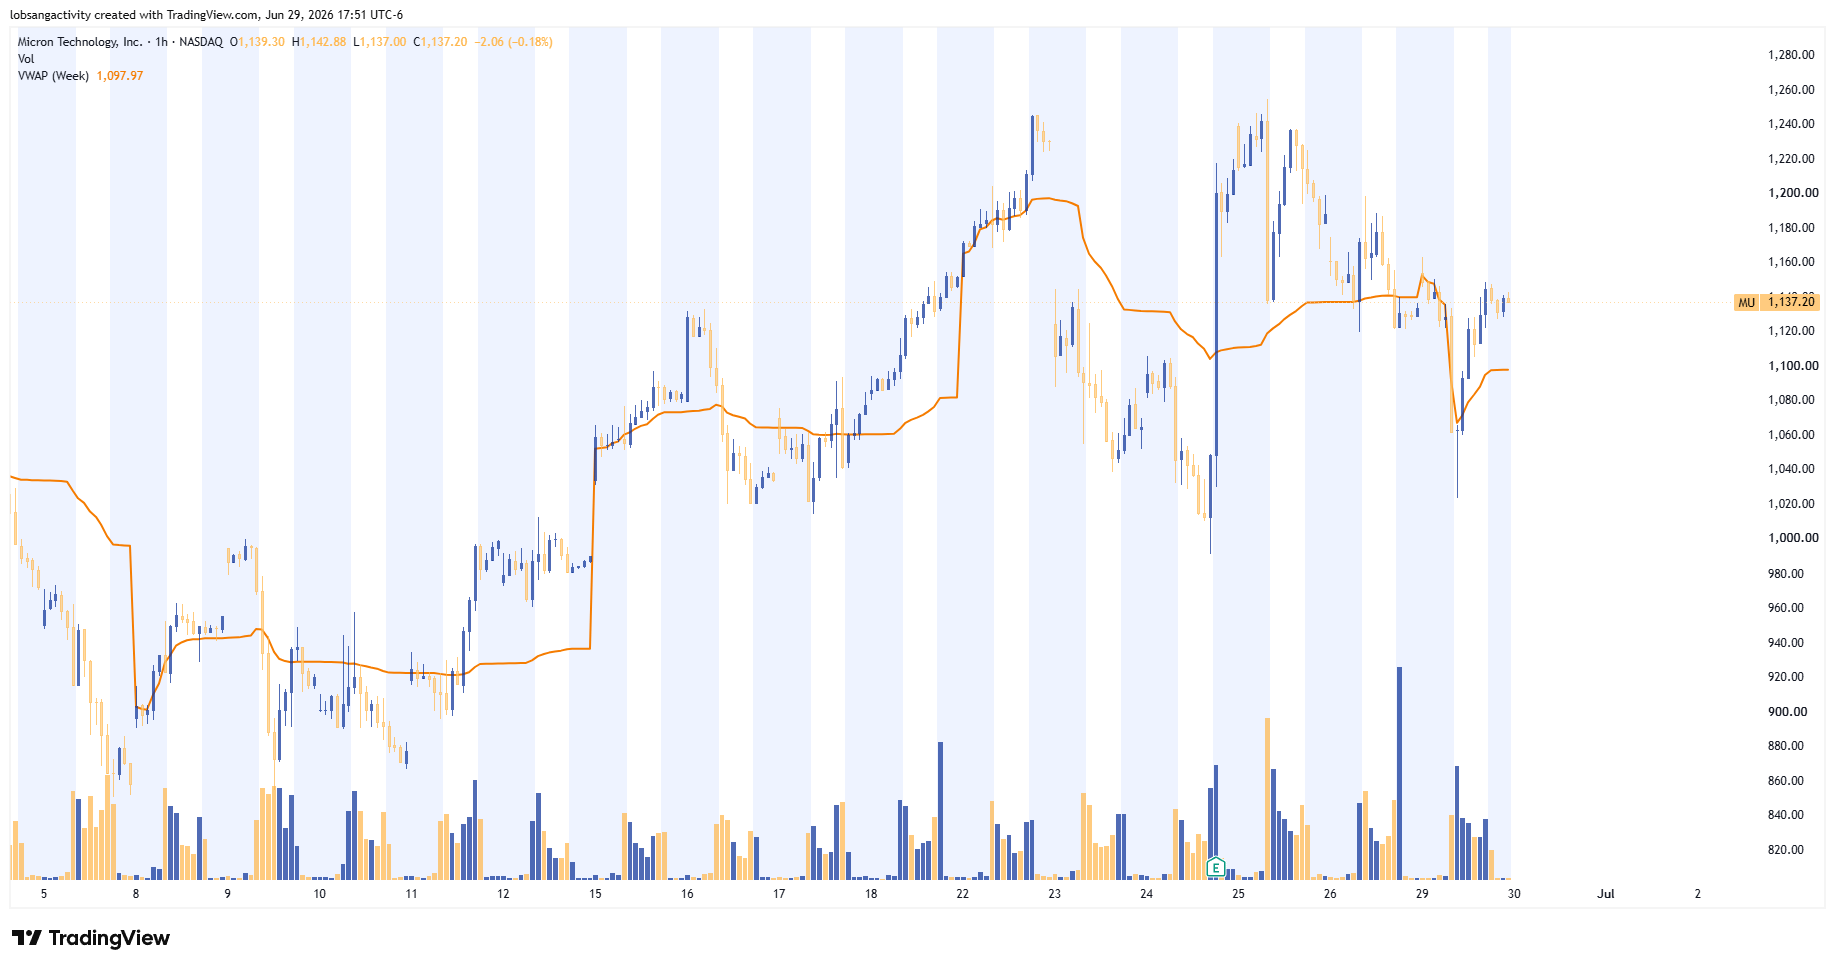
MU IMO is the messiest of the group, showcasing wide ranges, overlapping candles, no clean directional bias on the 1hr. After peaking near $1,250 on June 25th after the earnings spike, the open market reaction created a sharp flush to ~$1,000 followed by a solid bounce. The range itself tells the story: counter-trend players are very active, neither side in control with the overall trend still in place.
MU Weekly Chart
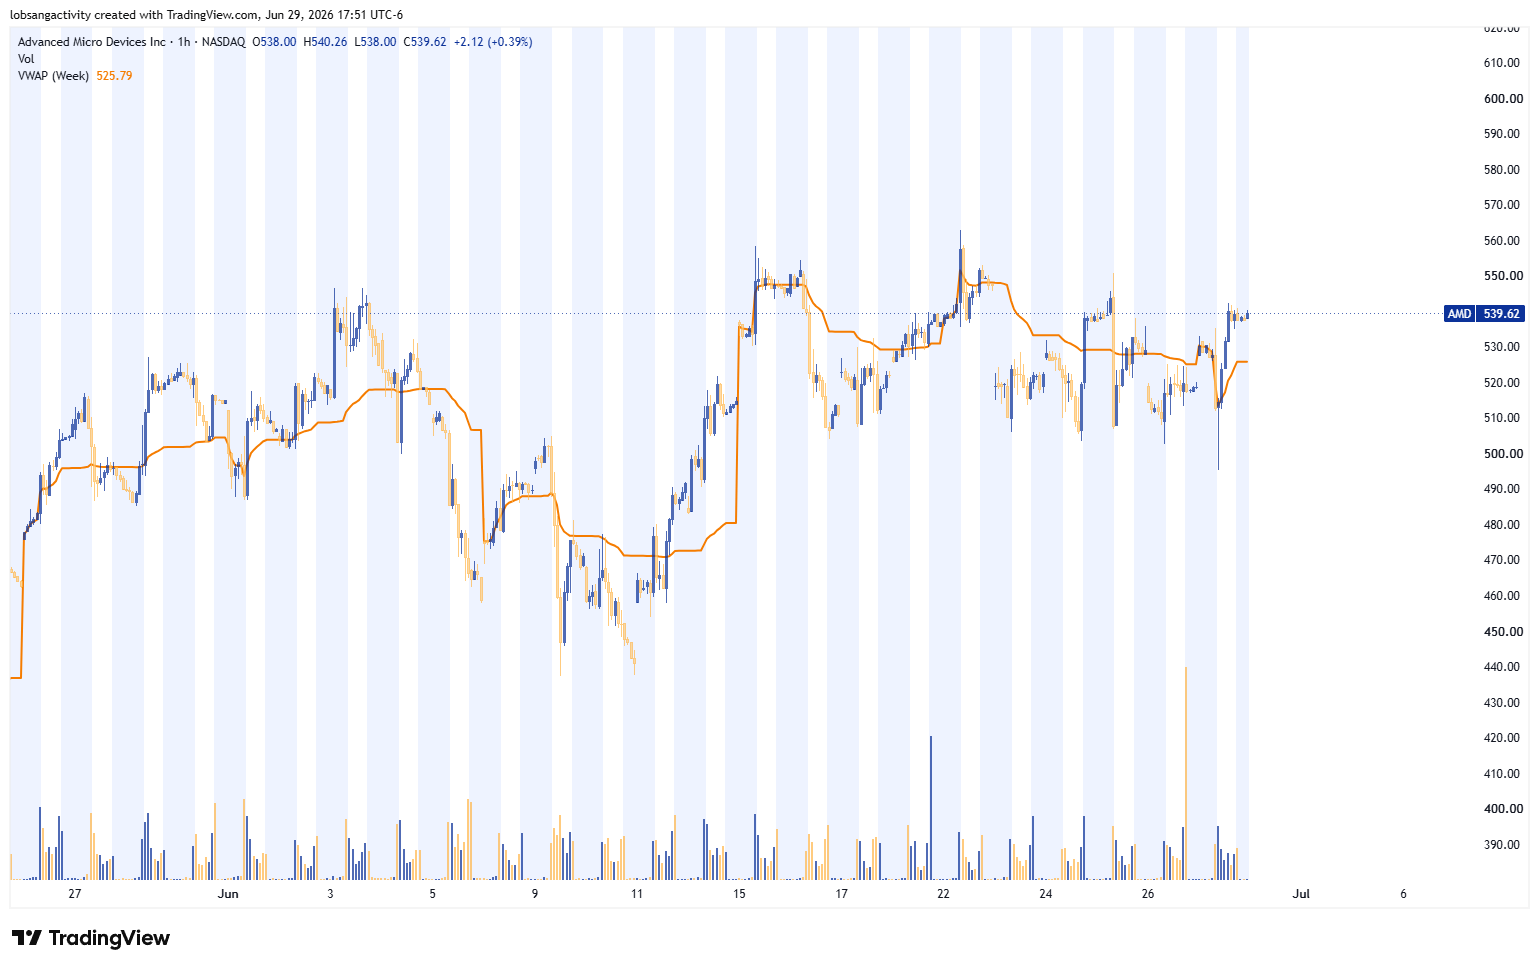
AMD
AMD is the real outlier and currently the strongest name in the group. After the mid-June push toward $555, the pullback has been controlled via a tight corrective structure near the highs while holding ground as the others deteriorate a bit more. It's not making aggressive higher lows, but it's not breaking either. AMD is the last one holding the best, which matters. However if AMD stops holding near the highs, the picture changes.
AMD Weekly Chart
What This Means Right Now
The positioning + flow don’t lie. The broad market is stalling at the top of a big move while its leadership quietly fractures. That doesn’t guarantee a reversal, but it communicates that the next directional move matters more than the last four weeks of sideways drift. Traders who can read positioning and order flow heading into that move will have an edge. Traders who can’t will be reacting to moves they will be less likely to anticipate.
That’s precisely what Thursday’s webinar is about.
Join Me This Thursday: “Why Most Traders Fail — And the System That Changes It”
📅 July 2nd, 4:30pm EST
I’m hosting a live webinar this Thursday walking through the exact framework I use to read institutional positioning, the options flow, and price action together, all via the same lens I applied to everything you just read above.
This will be a live webinar where I’ll show you how to read markets the way institutions do — before price moves, not after.
Only 36 spots remaining.
When the seat count hits zero, registration closes. No replays, no second chances.
I look forward to seeing you there.
— Chris
“The positioning + flow don’t lie...but the brain might.”
Chris Capre | Founder, 2ndSkies Trading | MSc Neuroscience Candidate